")
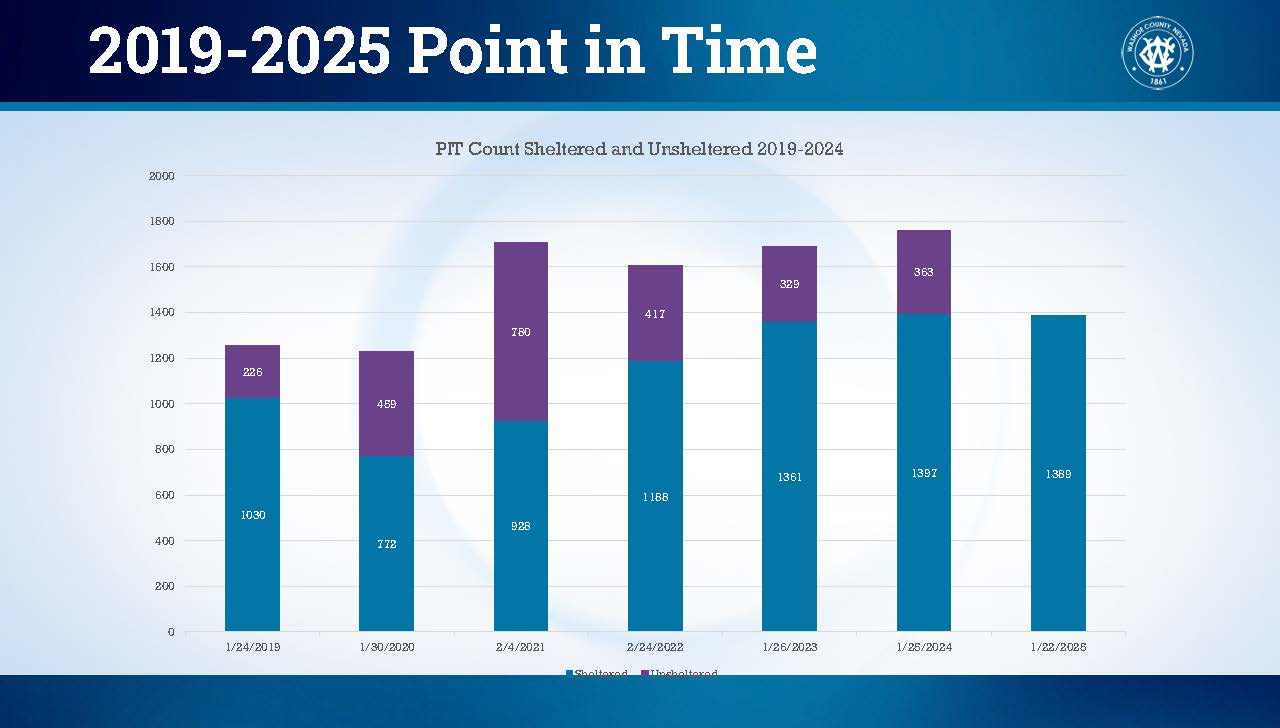
Methodology Summary – Please note that there was no unsheltered count for 2025
Conducted annually as required by the US Department of Housing and Urban Development
- Must be conducted during the last 10 days in January unless a waiver is granted
- Statewide, the PIT count was conducted on January 22, 2025
- 1,389 total person counted (emergency shelter and transitional housing)
- Decrease of 8 individuals compared to 2024 PIT Count Sheltered Totals
- 947 Male (68%), 429 Female (31%), 13 Gender that is not singularly ‘Female’ or ‘Male’ (e.g., non-binary, genderfluid, agender, culturally specific gender); Transgender; and Questioning,
- 1,106 in emergency shelter (decrease of 25 individuals from 2024)
- 283 in transitional housing (increase of 17 individuals from 2024)
Sheltered data is gathered through HMIS and agency submissions
Conclusions
- While there is a slight decrease in the total number of people experiencing homelessness, the total number of people counted is very similar to last year
- The PIT count is one time per year snapshot
- Many communities around the country are seeing significant increases
- Having 90% of providers enter data into HMIS allows us to analyze communitywide trends more frequently than annually
- Continued timely data entry is critical to this analysis
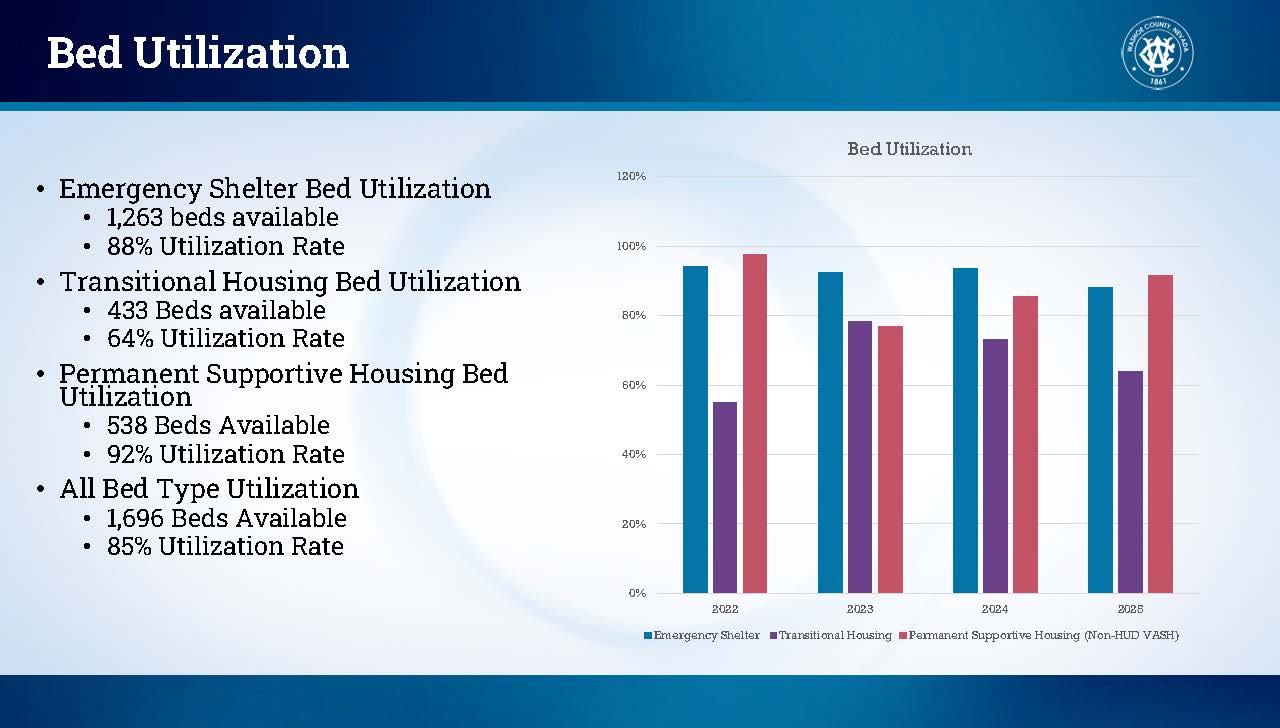
- Utilization overall has increased with Emergency Shelter and Permanent Supportive Housing having higher utilization rates than Transitional Housing
- If inflow continues to exceed outflow, the total number of people experiencing homelessness will continue to grow
- Affordable Housing stock for extremely low-income populations (30% or less) must increase to see further improvements in reducing the number of people experiencing homelessness
Inflow vs. Outflow
- Inflow is people falling into homelessness, outflow is when people are housed or become inactive in the system
- The number of people experiencing homelessness will increase when inflow exceeds outflow
- When people fall into homelessness, emergency shelter is utilized to meet the immediate need of providing shelter while more permanent solutions are pursued
- Ideally, inflow would be zero in our community
- Second to that goal, we want to be able to house people who fall into homelessness quickly