
In January, 2025, Sparks Justice Court (SJC) moved to a four-day work week, closing their offices on Fridays and switching to four 10-hour days Monday through Thursday.
This switch to a 4×10 work week resulted in significant reductions in energy use, energy costs, commute time and greenhouse gas emissions, as well as positive reviews from both staff and the public. The charts below compare summary data from 2025 and 2025. A detailed analysis follows.
| Summary Comparison January-October 2024-2025 | ||||
|---|---|---|---|---|
| 2024 | 2025 | Change | % change | |
| Electricity use (kWh) | 151,215 | 140,816 | -10,399 | -6.9% |
| Gas use (MMBTU) | 479.8 | 415.7 | -64.1 | -13.4% |
| Energy costs | $27,304 | $18,121 | -$9,183 | -33.6% |
| Building Emissions (MTCO2e) | 90.9 | 78.7 | -12.2 | -13.5% |
| Commute statistics | |
|---|---|
| Measure | Value |
| Fewer commute miles | 23,025 |
| Estimated gas dollar savings | $5,844 |
| Commute emissions saved (MTCO2e) | 13.1 |
| Combined emissions (building and commute) | |
|---|---|
| Measure | Value |
| Total emissions reduced (MTCO2e) | 25.3 |
| Value of emissions reduced | $4,807 |
Detailed analysis
Electricity use comparison for each month (2024 vs 2025)
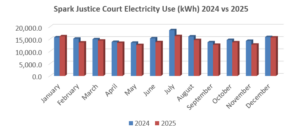
Chart: Electricity use by month for 2024 compared to 2025.
| Electricity use (kWh), monthly comparison (2024 vs 2025) | ||||
|---|---|---|---|---|
| 2024 | 2025 | Change | % change | |
| January | 15,675.8 | 16,107.2 | 431.4 | 2.8% |
| February | 15,142.9 | 13,585.4 | -1,557.5 | -10.3% |
| March | 14,901.9 | 14,355.6 | -546.2 | -3.7% |
| April | 13,812.4 | 13,435.3 | -377.1 | -2.7% |
| May | 13,496.1 | 12,549.1 | -947.0 | -7.0% |
| June | 15,284.5 | 13,719.6 | -1,564.8 | -10.2% |
| July | 18,577.5 | 16,188.8 | -2,388.7 | -12.9% |
| August | 16,031.5 | 14,572.9 | -1,458.6 | -9.1% |
| September | 13,678.1 | 12,647.9 | -1,030.2 | -7.5% |
| October | 14,614.3 | 13,654.2 | -960.1 | -6.6% |
| November | 14,252.1 | 12,709.8 | -1,542.3 | -10.8% |
| December | 15,800.4 | 15,612.8 | -187.7 | -1.2% |
| Total | 151,214.9 | 140,816.0 | -10,398.9 | -6.9% |
Gas use comparison for each month (2024 vs 2025)
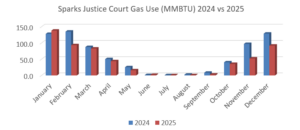
Chart: Building natural gas use by month for 2024 compared to 2025.
| Building natural gas use (MMBTU), monthly comparison (2024 vs 2025) | ||||
|---|---|---|---|---|
| 2024 | 2025 | Change | % change | |
| January | 128.1 | 138.1 | 10.1 | 7.9% |
| February | 135.0 | 93.3 | -41.8 | -30.9% |
| March | 87.5 | 82.9 | -4.7 | -5.3% |
| April | 50.4 | 43.9 | -6.5 | -12.9% |
| May | 25.4 | 15.9 | -9.5 | -37.5% |
| June | 1.3 | 1.9 | 0.6 | 43.5% |
| July | 0.8 | 0.8 | 0.0 | -1.3% |
| August | 2.5 | 0.9 | -1.6 | -64.0% |
| September | 8.4 | 2.7 | -5.8 | -68.4% |
| October | 40.5 | 35.5 | -5.0 | -12.4% |
| November | 97.1 | 52.3 | -44.9 | -46.2% |
| December | 128.8 | 91.9 | -36.9 | -28.6% |
| Total | 479.8 | 415.7 | -64.1 | -13.4% |
Comparing greenhouse gas emissions for each month (2024 vs 2025)
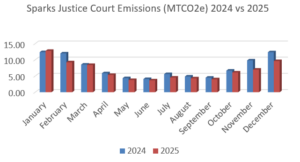
| Emissions (MTCO2e), monthly comparison (2024 vs 2025) | ||||
|---|---|---|---|---|
| 2024 | 2025 | Change | % change | |
| January | 12.37 | 12.77 | 0.4 | 3.2% |
| February | 11.99 | 9.24 | -2.8 | -22.9% |
| March | 8.53 | 8.41 | -0.1 | -1.4% |
| April | 5.85 | 5.34 | -0.5 | -8.7% |
| May | 4.34 | 3.77 | -0.6 | -13.1% |
| June | 4.07 | 3.66 | -0.4 | -10.1% |
| July | 5.60 | 4.52 | -1.1 | -19.3% |
| August | 4.85 | 4.29 | -0.6 | -11.5% |
| September | 4.49 | 3.99 | -0.5 | -11.1% |
| October | 6.67 | 6.09 | -0.6 | -8.7% |
| November | 9.82 | 6.98 | -2.8 | -28.9% |
| December | 12.35 | 9.63 | -2.7 | -22.0% |
| Total | 90.93 | 78.69 | -12.2 | -13.5% |
Comparing energy costs for each month (2024 vs 2025)
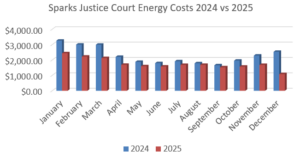
| Energy cost, monthly comparison (2024 vs 2025) | ||||
|---|---|---|---|---|
| 2024 | 2025 | Change | % change | |
| January | $3,261 | $2,441 | -$820 | -25.1% |
| February | $3,006 | $2,223 | -$783 | -26.0% |
| March | $2,998 | $2,128 | -$870 | -29.0% |
| April | $2,206 | $1,691 | -$515 | -23.3% |
| May | $1,882 | $1,596 | -$286 | -15.2% |
| June | $1,799 | $1,577 | -$222 | -12.3% |
| July | $1,920 | $1,683 | -$237 | -12.3% |
| August | $1,789 | $1,685 | -$104 | -5.8% |
| September | $1,658 | $1,527 | -$131 | -7.9% |
| October | $1,960 | $1,570 | -$390 | -19.9% |
| November | $2,290 | $1,682 | -$608 | -26.6% |
| December | $2,535 | $1,083 | -$1,452 | -57.3% |
| Total | $27,304 | $18,121 | -$9,183 | -33.6% |
Employee reviews
Twenty-six Sparks Justice Court employees filled out a survey, reviewing this change positively in terms of more productive time in office, better work-life balance and better physical and mental health. Employees also reported positive reviews from the public because of later office hours Monday through Thursday. Here are some of the quotes in the survey:
“I love it! I’m so thankful we’re able to run this schedule. I’ve never felt so balanced in my family and work life.”
“A four-day work week should become the norm and not the exception. It creates a better work/life balance and improves quality of both work and home life.”
“The building is now cleaned four days a week instead of five. We were also able to open during the lunch hour and extend public operating hours Monday through Thursday.”
“Four-day work weeks are the best ever! I hope it is always this awesome!”
“There is a better moral at work amongst coworkers. I also feel like I get more done. Fridays were always slow. The public appreciates the earlier and late hours and lunch hour being open. I also like that we are contributing to not using energy in our courthouse.”
“Benefit: I walk for the full 30 minutes at lunch, which is way better for my mental health compared to when we had an hour lunch and I would find other things to do such as drive to a friend’s house or shop.”
“Benefits that I get with my 4-day schedule is the extra day that we have. I can schedule appointments without having to request much time off from work.”
“More personal time, more time with family. Ability to conduct business or attend medical appointments during a weekday without having to schedule time off of work.”
“Benefits are more time with family, less time commuting, energy levels after having an extra day off have increased, less time off from work requested for appointments. Love the 4-day work week.”
“BEST thing ever… so glad we were given an opportunity to try it out to help use less energy and save money for the county. More work productivity being completed too!”
“Benefits: Saving on gas and money, not going out to eat or shopping on my lunch breaks. Eating healthier by packing my lunch. Saving miles on my vehicle by not driving around on my lunch breaks every day. Love having Fridays off to run errands, take and pick up kids from school and going to appointments without having to take time off of work.”
“The longer workday has been an adjustment affecting dinner time and bedtime. But the benefit of the additional day on the weekend by far outweighs the inconvenience of eating dinner so close to bedtime.”
After seven months of data, the general trends are clear: this switch to 4×10s resulted in benefits across the board.
Caveats, notes and sources
- In northern Nevada, colder weather results in higher natural gas use for heat; warmer weather results in higher electricity use for air conditioning. Weather was different in 2024 and 2025, and these data have not been normalized for weather. In general, fall-winter 2024 to 2025 was colder than fall-winter 2025. For these reasons, the differences reported for each month and year-over-year cannot be evaluated precisely.
- Commute data and savings are based on survey data provided by 26 SJC employees, based on 48 fewer trips to the office for each employee during 2025. Individual data will vary for each employee based on miles traveled, vehicle fuel efficiency, type of vehicle, additional days off and other factors.
- Gas prices estimated at $4 per gallon.
- Vehicle emissions per gallon of gas based on EPA data.
- Value of emissions reduced based on $190 per ton using the Social Cost of Carbon with a 3% discount rate for the year 2025.